I have started to develop frontend side of my pet project and yesterday I worked on login service and I had to debug it. I use Visual Studio Code to write app in angular2 and typescript and I thought why not to use VS Code for debugging? Ok, but not so fast. Few steps are required to achieve it.
In VS code open cmd palette with key combination Ctrl+Shift+P and type:
|
1 |
ext install |
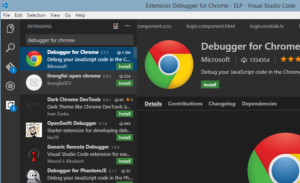
Then type Debugger for Chrome in extensions manager and install it.
After installation restart VS code.
Next go to Debugger or press Ctrl+Shift+D and click on the gear icon to create launch.json file.
By default it looks like this:
|
1 2 3 4 5 6 7 8 9 10 11 12 13 14 15 16 17 18 19 20 21 22 23 |
{ // Use IntelliSense to learn about possible Node.js debug attributes. // Hover to view descriptions of existing attributes. // For more information, visit: https://go.microsoft.com/fwlink/?linkid=830387 "version": "0.2.0", "configurations": [ { "type": "node", "request": "launch", "name": "Launch Program", "program": "${workspaceRoot}\\serve", "outFiles": [] }, { "type": "node", "request": "attach", "name": "Attach to Process", "address": "localhost", "port": 5858, "outFiles": [] } ] } |
but to be able to debug angular app you need to modify it. My launch.json file looks like this:
|
1 2 3 4 5 6 7 8 9 10 11 12 13 14 15 16 17 18 19 20 21 22 23 24 25 26 27 |
{ "version": "0.2.0", "configurations": [{ "name": "Launch Chrome against localhost, with sourcemaps", "type": "chrome", "request": "launch", "url": "http://localhost:4200/", "runtimeArgs": [ "--user-data-dir", "--remote-debugging-port=9222" ], "sourceMaps": true, "diagnosticLogging": true, "webRoot": "${workspaceRoot}", "userDataDir": "${workspaceRoot}/.vscode/chrome" }, { "name": "Attach to Chrome, with sourcemaps", "type": "chrome", "request": "attach", "url": "http://localhost:4200/", "port": 9222, "sourceMaps": true, "diagnosticLogging": true, "webRoot": "${workspaceRoot}" }] } |
Url is default url where angular app is located, port: 9222 is the port used by Chrome browser.
In this config file there are two configs, one of these is for launching chrome with attached debugger and the second one is for attaching existing chrome instance. Let’s try to launch new chrome window. Click on green start icon.
Now you can just put a breakpoint in VS Code, wherever you want and you can debug your angular app 😉


